
5 Steps to Analyze Preforeclosure Value
Want to make smart preforeclosure investments? Here's a quick guide to help you accurately assess property value and avoid costly mistakes. Preforeclosure properties are often sold below market value, making them attractive to investors. But without proper analysis, you risk overpaying or underestimating repair costs. Follow these five steps:
- Collect Property Information: Research public records for legal and financial details, inspect the property in person, and document key features like size, condition, and layout.
- Find Comparable Properties: Use recently sold homes with similar features in the same area to estimate the property's current value.
- Review Current Listings: Check active and pending listings to understand the competition and current market trends.
- Adjust Comparable Values: Account for differences in features, condition, and location between your property and comps. Calculate After Repair Value (ARV) to estimate potential profit.
- Determine the Final Value Range: Establish a realistic price range, combining "as-is" value with ARV, while factoring in repair and market conditions.
Pro Tip: Tools like Comparative Market Analysis (CMA) and platforms like LeadList.Pro can simplify this process by providing accurate data and insights. Stick to the numbers, inspect properties in person, and focus on market trends to make informed decisions.
::: @figure 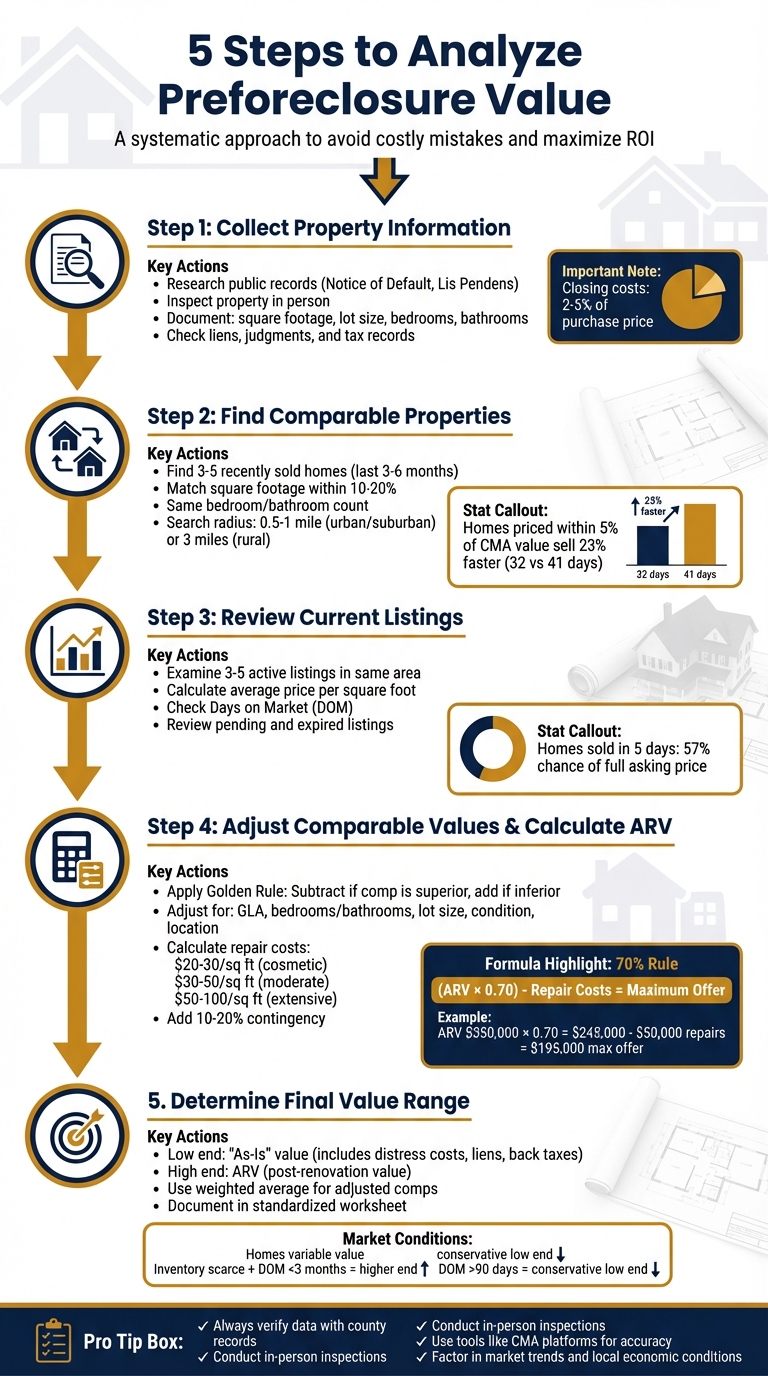 {5-Step Process to Analyze Preforeclosure Property Value}
:::
{5-Step Process to Analyze Preforeclosure Property Value}
:::
Mastering the Art of Pre-Foreclosure Deal Analysis | Strategies, Tools, and Profits Unveiled!
Step 1: Collect Property Information
When evaluating a preforeclosure property, the first step is gathering all essential details about it. Missing a critical piece of information - like an unpaid tax lien or hidden structural damage - can quickly turn what seems like a great deal into a costly mistake. A thorough data collection process helps you avoid overpaying and shapes your overall investment strategy. Start by focusing on both the physical and financial aspects of the property.
Begin your research at the local county recorder's office or tax assessor's office to access public records. Look for filings such as a Notice of Default or Lis Pendens to confirm the property’s legal situation. While online tools can provide a general overview, nothing beats seeing the property in person. Issues like foundation cracks, aging siding, or a leaking roof often go unnoticed in records but can heavily impact the property's value.
Property Characteristics
Take note of key property details, including the address, type of property, square footage, lot size, and the year it was built. Be sure to document the layout - how many bedrooms, bathrooms, and floors it has - as well as its overall structural condition. Look for deferred maintenance or necessary repairs, and highlight any unique features like a swimming pool, fireplace, attached garage, or distinctive design elements. Even small inaccuracies, such as incorrect square footage, can throw off your calculations, especially when determining price-per-square-foot.
Financial and Legal Records
Physical details are just one piece of the puzzle. You’ll also need to dig into the property's financial and legal background. Record the outstanding mortgage balance, the payment history, and any missed payments. Check for liens, judgments, easements, and legal notices that could affect the property. Don’t forget to factor in annual property taxes, including any unpaid amounts or tax liens, as these obligations usually transfer with the property. Lastly, remember that closing costs for preforeclosure deals typically range between 2% and 5% of the purchase price [1]. Accounting for all these financial details is vital to ensure the investment remains profitable.
Step 2: Find Comparable Properties
After gathering all the details about your property, the next move is to locate recently sold homes that closely match its key features. Aim to find three to five strong examples that reflect current market trends. Without accurate comparable properties (or "comps"), you run the risk of pricing your property incorrectly, which could lead to missed opportunities or reduced profits.
Focus on properties sold within the last three to six months. Using outdated data can distort your analysis and lead to poor pricing decisions. According to a 2023 National Association of Realtors study, homes priced within 5% of their Comparative Market Analysis (CMA) value sold 23% faster - spending an average of 32 days on the market compared to 41 days for homes priced outside that range [4].
Once you've identified recent sales data, the next step is to narrow down comps that align closely with your property's unique characteristics.
Selection Criteria for Comparables
Start by comparing the physical features of your property with potential comps. Look for homes with square footage that falls within 10–20% of your property’s size. The number of bedrooms and bathrooms should match as closely as possible; for instance, a three-bedroom house isn’t a suitable comparison for a five-bedroom one. Pay attention to other factors like lot size, architectural style, and the home’s age - a 1920s craftsman bungalow isn’t comparable to a modern home built in 2010, as they cater to different buyers and come with varying maintenance costs.
Stick to comparing similar property types. For example, single-family homes should only be compared with other single-family homes, and condos with other condos. Additionally, consider specific features such as garage size (e.g., a two-car garage versus a one-car garage), recent upgrades (like a remodeled kitchen), or major repairs (such as a new roof). As Saleswise puts it:
A great CMA tells the property's unique story. It's not just a three-bedroom house; it's a three-bedroom house with a kitchen remodeled last year... and a brand-new HVAC system [4].
Once you've established the physical criteria, ensure the selected comps also share similar geographic and market characteristics.
Apply Local Market Data
Location matters - a lot. If the property is in an urban or suburban area, focus your search within a half-mile to one-mile radius. This ensures the comps share similar schools, amenities, and neighborhood dynamics [4]. Avoid crossing major dividers like highways, rivers, or railroad tracks, as these can separate areas with significantly different pricing trends. In rural locations, where homes are more spread out, you might need to extend your search to a three-mile radius. Even then, make sure the properties are in comparable market conditions and school districts.
Use tools like the "Recently Sold" filter on platforms such as Zillow or your local MLS to find actual sale prices rather than listing prices. Whenever possible, drive by the comps to check for external factors that photos might not show - like proximity to power lines or the presence of a nearby park. These small details can greatly influence a property’s value and help you choose the most accurate comps for your analysis.
Step 3: Review Current Listings and Market Conditions
Once you've reviewed recently sold properties, it's time to shift your focus to active listings. These provide a snapshot of your competition and highlight the price ranges buyers are currently considering. While sold properties give you historical data, active listings reflect the present market mood.
Examine Active Listings
Look for 3–5 active listings within a one-mile radius of your property (or up to three miles if you're in a rural area) that share similar characteristics. Adjust the search radius depending on whether you're in an urban or rural setting. Use the same criteria outlined in Step 2 - square footage within 10–20% (or 300 square feet), matching bedroom and bathroom counts, architectural style, and age range.
Calculate the average price per square foot by dividing each listing's price by its square footage, then averaging those figures. For instance, if the average price per square foot from three listings is $150 and your property is 1,800 square feet, you can estimate a baseline value of $270,000.
Don't overlook pending listings, as they offer clues about what buyers are currently willing to pay. On the flip side, expired or withdrawn listings can be just as informative. As Saleswise explains:
Listings that failed to sell almost always tell a story of overpricing. They essentially define the market's price ceiling - the point where buyers collectively said, 'Nope, not for that much' [4].
These examples are a valuable guide to avoid pricing your property too high.
Consider Market Factors
Active listings are only part of the equation; broader market conditions also play a crucial role in setting the right price. Take a close look at the Days on Market (DOM) for homes in your area. If properties are sitting unsold for longer than usual, it could indicate a buyer's market, where negotiation leans in favor of buyers. On the other hand, homes that sell quickly - sometimes within a week - signal heightened competition and possibly higher prices. Zillow notes that homes sold within five days have a 57% chance of achieving their full asking price, while this likelihood drops to 39% after the first few weeks [6].
Check inventory levels to understand supply and demand dynamics. A surplus of homes gives buyers the upper hand, often leading to lower prices, while a shortage can drive prices up [3][2]. Local economic trends also matter - major layoffs or new businesses entering the area can directly affect what buyers can afford [2][6]. Additionally, factors like upcoming zoning changes, new schools, or proximity to parks versus industrial zones can impact a property's value [2][1].
It's important to remember that active listing prices reflect what sellers hope to get, not necessarily what buyers are willing to pay. These prices are often inflated and should complement your sold data rather than replace it [7][5]. Frequent price reductions on active listings can be a warning sign. As BiggerPockets points out:
Lowering a home's asking price clearly indicates something was miscalculated at the beginning of the sales process [6].
sbb-itb-fc184bb
Step 4: Adjust Comparable Values and Calculate ARV
Adjust for Property Differences
When comparing properties, adjustments are necessary to account for differences between your subject property and the comparables. This process follows the "Golden Rule of Adjustments": if a comparable property has features that make it superior - like an extra half-bath - you subtract the value of that feature from the comparable's sale price. Conversely, if the comparable is lacking something, you add the value of that missing feature to its price [4].
For example, let’s say your subject property has 3 bedrooms and 2 bathrooms, and you’re comparing it to "Comp 1", which sold for $450,000. If Comp 1 has an additional half-bath worth $5,000, you subtract that value, adjusting the comp's price to $445,000 [4].
Adjustments should also account for factors like gross living area (GLA), bedroom and bathroom count, lot size, garage space, property condition, and location. Features like proximity to schools or shopping can add value, while drawbacks like being near train tracks or in a flood zone can reduce it [3][8]. Always cross-check MLS data against public tax records to confirm square footage, especially since unpermitted additions like sunrooms might not count legally toward the gross living area [4].
When finalizing your valuation, use a weighted average rather than a simple average. Comparables requiring fewer adjustments are more reliable and should carry greater weight in your calculations [4]. This method matters because homes priced within 5% of their calculated value tend to sell faster - averaging 32 days on the market compared to 41 days for those priced outside that range [4].
Once your adjustments are complete, you can move on to estimating the After Repair Value (ARV), factoring in renovation costs.
Calculate After Repair Value (ARV)
The ARV represents the property’s value after renovations are complete. To calculate this, rely on the adjusted comps you’ve already prepared, focusing on properties that were recently renovated or flipped [11]. Use these comps as benchmarks and subtract all repair costs needed to bring your property to a similar condition.
Repair costs can vary widely. Cosmetic repairs typically range from $20–$30 per square foot, moderate renovations from $30–$50 per square foot, and extensive work can exceed $50–$100 per square foot. It’s wise to include a 10–20% contingency for unexpected expenses [11]. Don’t forget to account for non-renovation costs, such as holding, financing, and selling expenses, which often total around 10–15% of the ARV [11].
A common tool for investors is the 70% Rule, which helps determine the maximum price you should offer. The rule suggests offering 70% of the ARV minus estimated repair costs. For instance, if the ARV is $350,000 and repair costs are $50,000, your maximum allowable offer would be $195,000. Here’s the math: $350,000 × 0.70 = $245,000, then subtract $50,000 for repairs, leaving $195,000 [9].
To stay organized, use CMA worksheets or spreadsheets to document your calculations and adjustments. Finally, conduct a title search to check for hidden liens, such as second mortgages, mechanic’s liens, or unpaid HOA fees, as these can reduce the equity available to you [10].
Step 5: Determine the Final Value Range
Use LeadList.Pro Data

To establish a solid value range, combine your adjusted comparables with your ARV. Reliable data is the backbone of this process[4].
For investors in Massachusetts, LeadList.Pro provides AI-driven distress scores and weekly updates. This ensures you’re working with up-to-date market data and verified court records. The platform can also flag issues like unpermitted additions, which might impact property value[4].
Be sure to cross-check your lead data with county records. In Massachusetts, for example, a Lis Pendens filing signals the start of a judicial foreclosure process[12]. Once your data is verified, consolidate everything into a clear and defensible value range.
Define and Present Your Value Range
Your value range should be anchored with two key points:
- The low end: The "As-Is" value, which accounts for distress costs like mortgage payoffs, reinstatement fees, back taxes, and liens.
- The high end: The ARV (After Repair Value), representing the property’s potential value post-renovation[12].
To refine this range, apply a weighted average to your adjusted comparables, giving priority to those requiring minimal adjustments[4]. For instance, if your analysis produces a tight cluster of three to five strong comparables, that cluster forms the foundation of your value range.
Document your findings in a standardized worksheet. This not only ensures transparency and repeatability but also strengthens your position during negotiations[3]. Market conditions will also influence your final range. If inventory is scarce or marketing times are under three months, you might lean toward the higher end. On the other hand, if properties are sitting on the market for over 90 days, a more conservative low-end valuation is likely the safer choice.
Conclusion
Evaluating preforeclosure value isn’t about taking a wild guess - it’s about following a clear, structured process to safeguard your investment from the outset. This approach involves gathering accurate data, selecting the right comparables, assessing the market, calculating the After Repair Value (ARV), and determining a realistic value range. Skipping any of these steps could lead to overpaying or missing potential risks.
Solid data is your best defense. As BiggerPockets explains, "An accurate CMA may help you determine if a particular real estate investing strategy - like fix and flip or BRRRR - is a good option for a property" [2]. To ensure you're working with reliable information, verify public records and conduct in-person inspections. This way, you’re basing decisions on facts - not assumptions.
Market conditions add another layer of insight. For instance, if homes are selling quickly, it’s a clear sign of strong buyer demand, which can help you time your offers strategically. Pair this with data like neighborhood trends, Days on Market (DOM), and local employment stats, and you’ll have a clearer picture of whether you’re operating in a buyer’s or seller’s market.
When you combine accurate data with a deep understanding of market trends, your investment strategy becomes much stronger. For investors in Massachusetts, tools like LeadList.Pro simplify this process. By offering AI-driven distress scores, weekly updates from local courts, and verified property details in easy-to-use CSV files, the platform lets you focus on analyzing deals. It even flags potential red flags, like unpermitted additions, and provides full contact details so you can act fast on promising opportunities.
A detailed analysis can mean the difference between a profitable investment and a costly mistake. Stick to these five steps, rely on verified data, and always back up your assumptions with in-person inspections and up-to-date market insights.
FAQs
::: faq
How can I find accurate comparable properties for analyzing a preforeclosure’s value?
To analyze a preforeclosure property effectively, start by pinpointing its key features: lot size, square footage, number of bedrooms and bathrooms, year built, and overall condition. These details are essential for identifying comparable properties (comps) that closely match your subject property.
Next, collect recent sales data from credible sources like your local MLS, county records, or trusted online platforms. For preforeclosures specifically, tools like LeadList.Pro can be incredibly helpful, offering weekly leads with detailed property and market insights. Focus on comps within the same neighborhood or a 0.5-mile radius, ensuring they are similar in size, age, and condition.
Once you’ve gathered your data, adjust for any differences in features - like a newly renovated kitchen or a finished basement - and calculate an average price per square foot to estimate the property’s value. To confirm your analysis, cross-check your results with active listings or additional preforeclosure data. Don’t forget to document your sources for accuracy and future reference. :::
::: faq
What should I consider when determining a property's After Repair Value (ARV)?
To calculate a property's After Repair Value (ARV), consider these essential factors:
- Recent comparable sales: Check similar properties in the area that sold within the last 3 to 6 months. These give you a baseline for pricing.
- Location: Evaluate the neighborhood's appeal, access to amenities, and overall desirability.
- Property size and features: Factor in the square footage, number of rooms, and extras like a pool or garage.
- Current condition and planned upgrades: Examine the property's current state and estimate how planned renovations or repairs will impact its value.
- Market trends: Study local real estate patterns, including price changes or seasonal demand shifts.
By thoroughly reviewing these factors, you can estimate ARV more accurately and make smarter investment choices. :::
::: faq
How do market conditions impact preforeclosure investment strategies?
Market conditions have a big influence on how investors approach preforeclosure opportunities, shaping both the availability of properties and the level of demand from buyers. For instance, in a slow housing market where prices are dropping and inventory is higher, sellers in preforeclosure are often more eager to sell quickly. This gives investors the upper hand in negotiations and opens the door to buying properties below market value. On the flip side, in a booming seller’s market with rising prices and tight inventory, investors may need to act quickly, offer cash, or even cover closing costs to secure a deal.
Economic factors also play a key role. When interest rates rise or credit becomes harder to access, the pool of qualified buyers shrinks. This can make flipping or renting properties more challenging. In such cases, investors might shift their focus to long-term rental strategies or wholesale deals. Similarly, an increase in foreclosure activity can provide more leads, but it often comes with heightened competition. To stay ahead, investors need to rely on real-time data and quick, efficient property analysis.
Local trends - like job growth, population changes, and shifts in regional home prices - are equally important. These factors should be carefully analyzed through a comparative market analysis (CMA) to ensure pricing and profit estimates are accurate. By staying informed and leveraging the latest tools, investors can better navigate market changes and make smarter, more strategic decisions. :::


