
Foreclosure Rates Map: U.S. 2025 Overview
Foreclosure rates in the U.S. surged in 2025, reflecting growing financial strain on homeowners. Key highlights include:
- Foreclosure filings: 36,766 properties in October alone, up 19% year-over-year.
- Contributing factors: Rising property insurance costs (up 70% in 5 years), mortgage rates doubling (3% to 6%), and home prices increasing by 40% since the pandemic.
- Regional hotspots: Florida, South Carolina, and Illinois led foreclosure rates, with Florida reporting one foreclosure for every 1,829 housing units in October.
- Timeline trends: Average foreclosure processing time dropped to 608 days in Q3 2025, a 25% decrease from 2024.
For real estate professionals and investors, this data highlights opportunities in high-foreclosure areas while emphasizing the importance of due diligence and timely action.
2025 National Foreclosure Overview
Key National Statistics
The foreclosure landscape in 2025 has shown some noticeable changes when compared to previous years. During the first half of 2025, foreclosure filings were recorded on 187,659 properties, marking a 5.8% increase from the same period in 2024. The national foreclosure rate was 0.13%, translating to one filing for every 758 housing units [8][9]. Within this timeframe, 140,006 properties entered the foreclosure process, while lenders repossessed 21,007 properties - a 12% rise compared to the prior year. By the third quarter, 169,220 new foreclosures were reported, coming close to the full-year total of 174,100 recorded in 2024 [11]. These figures highlight broader economic challenges, mirrored in delinquency trends.
Interestingly, the serious delinquency rate - defined as loans overdue by 90 days or more - remained relatively stable at 0.83% in the third quarter of 2025. To put things into perspective, foreclosure starts in the first half of 2025 were 41% higher than those in the same period of 2020. However, they remain significantly lower than the levels seen during the 2008 housing crisis [8][11]. These national trends set the stage for examining regional disparities in foreclosure activity.
Foreclosure Timeline Trends
The pace at which foreclosures are processed has also undergone notable changes. In the second quarter of 2025, the average time properties spent in foreclosure was 645 days. This represents a 21% reduction from the previous year and a 4% dip from the preceding quarter [8][9]. However, the time it takes to complete a foreclosure varies widely by state. Wyoming recorded the shortest average timeline at 125 days, followed by Texas at 135 days and New Hampshire at 149 days. On the other end of the spectrum, Louisiana had the longest timeline at 3,612 days, with Hawaii and Nevada averaging 2,746 days and 1,974 days, respectively [8][9]. These differences are largely influenced by state foreclosure laws, as judicial states - where court approval is required - tend to have longer timelines compared to non-judicial states.
| State | Average Days to Foreclose (Q2 2025) |
|---|---|
| Wyoming | 125 days |
| Texas | 135 days |
| New Hampshire | 149 days |
| Louisiana | 3,612 days |
| Hawaii | 2,746 days |
| Nevada | 1,974 days |
Why Foreclosures Keep Rising (New Oct 2025 Report Explained) Is a Foreclosure Wave Forming?
State-by-State Foreclosure Rates
::: @figure 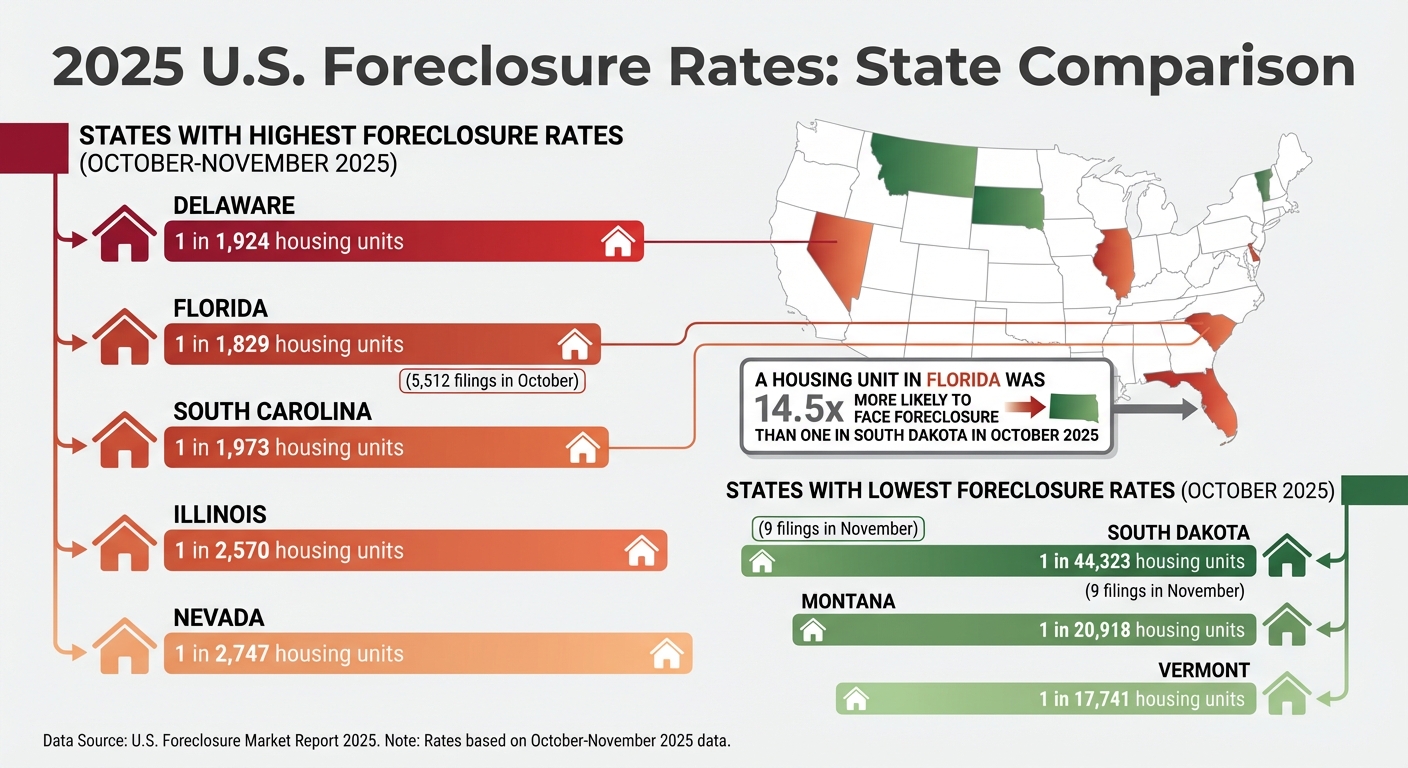 {2025 U.S. Foreclosure Rates by State: Top and Bottom Performers}
:::
{2025 U.S. Foreclosure Rates by State: Top and Bottom Performers}
:::
This section dives into state-level foreclosure trends for 2025, building on the broader national patterns. These state-specific figures shed light on how economic challenges play out across different regions.
States with the Highest Foreclosure Rates
In 2025, Florida topped the list with the highest foreclosure rate, reporting one foreclosure for every 1,829 housing units in October - totaling 5,512 filings. South Carolina followed with one in every 1,982 units, and Illinois came in third at one in every 2,570 units. Rounding out the top five were Delaware and Nevada, with rates of one in every 2,710 and 2,747 housing units, respectively [1][2].
By November 2025, Delaware took the lead with the nation's worst foreclosure rate, recording one in every 1,924 housing units. South Carolina wasn’t far behind, maintaining a rate of one in every 1,973 units [12]. The persistence of these states in the top rankings throughout the year points to what analysts call a nationwide normalization of foreclosure activity, rather than isolated regional problems. Megan Hunt, Marketing Manager at ATTOM, explained:
"This geographic spread, from the Mid-Atlantic to the Southeast and West, suggests that foreclosure activity is being shaped by nationwide affordability hurdles, persistent borrowing costs, and localized market pressures rather than a single regional driver" [10].
While some states faced significant challenges, others saw much lower foreclosure rates.
States with the Lowest Foreclosure Rates
At the opposite end of the spectrum, South Dakota reported the lowest foreclosure rate in the country for 2025. In October, it recorded just one filing per 26,594 housing units (15 total filings) [2][5]. By November, this improved even further to one in every 44,323 households, with only 9 foreclosures for the entire month [12]. Montana and Vermont also demonstrated notable stability, with rates of one in every 20,918 and one in every 17,741 housing units in October, respectively [2].
To put this into perspective, a housing unit in Florida was approximately 14.5 times more likely to face foreclosure than one in South Dakota during October 2025 [5]. This stark contrast underscores the influence of local economic conditions and market dynamics on foreclosure activity.
Top Metro Areas by Foreclosure Activity
Metro Areas with the Most Foreclosures
Looking at foreclosure data from metropolitan and county levels in 2025 reveals key regions of interest for investors. Early in the year, Lakeland, Florida, stood out among metros with populations over 200,000, reporting a 0.29% foreclosure rate [14]. Columbia, South Carolina, followed closely at 0.28%, while Chicago, Illinois, and Ocala, Florida, each recorded rates of 0.26% [14]. By the third quarter, Lakeland’s rate climbed to one foreclosure for every 470 housing units. Columbia, SC, and Cape Coral, FL, also saw notable rates, with one foreclosure per 506 and one per 589 units, respectively [3].
For larger metropolitan areas (populations exceeding one million), the landscape shifted later in the year. By November, Philadelphia, Pennsylvania, reported one foreclosure for every 1,511 housing units, a figure influenced by resumed data collection and the processing of backlogged records [6]. In October, Tampa, Florida, had a slightly higher rate of one foreclosure per 1,373 units [1]. Other major cities like Las Vegas, Nevada (one in 2,013), Cleveland, Ohio (one in 2,114), and Orlando, Florida (one in 2,282) also saw increased foreclosure activity [6].
When it came to completed foreclosures, Philadelphia led in November 2025 with 160 bank repossessions (REOs), followed by Chicago with 152 and Houston with 134 [6]. Foreclosure starts earlier in the year were dominated by Chicago, which saw 3,789 new filings in Q1 2025. New York followed with 3,566, and Houston came in third with 3,046 [15]. These trends provide a foundation for analyzing foreclosure activity on a more localized, county-level scale.
County-Level Data
The metro trends mirror patterns observed at the county level. In Florida, Osceola, Charlotte, and Okeechobee counties reported the highest foreclosure rates in October [2][5]. Osceola County, located near the Orlando metro area, highlights how specific local economic conditions can shape market dynamics. In South Carolina, the counties with the highest rates were Dorchester, Lee, and Spartanburg [2]. Illinois saw its foreclosure activity peak in Clinton, Lee, and Coles counties [2]. Nevada’s hotspots included Lyon, Churchill, and Mineral counties, while Ohio’s most affected areas were Fayette, Knox, and Seneca counties [2]. These county-level insights are invaluable for investors aiming to target areas with the highest potential for distressed property opportunities.
Year-Over-Year Trends and Regional Patterns
Year-Over-Year Comparisons
Foreclosure filings in 2025 showed a steady upward trend, with increases recorded for eight consecutive months by October [1]. Foreclosure activity overall posted notable year-over-year growth across all metrics. Filings rose by 5.8% in the first half of 2025 compared to 2024, surged 17% in the third quarter, and jumped 19% in October [4][7][1]. A similar pattern was observed in foreclosure starts and completions. Starts increased by 7% in the first half and 20% in October, while completions climbed 12% in the first half and spiked 32% in October [4][1]. Additionally, the average foreclosure timeline shortened significantly, dropping 25%. Properties foreclosed in the third quarter of 2025 took an average of 608 days to complete the process, compared to 811 days in the same period the previous year [7].
Some states saw the sharpest increases in foreclosure activity during the first half of 2025. Alaska led the way with a 55% rise, followed by Rhode Island (51%), Wyoming (46%), Utah (46%), and Colorado (41%) [4]. In contrast, South Dakota experienced a sharp decline of 44.71%, with Maryland (23.25%), Massachusetts (22.78%), Mississippi (20.84%), and the District of Columbia (16.84%) also reporting decreases [4]. Experts have described these trends as a "gradual normalization" of foreclosure volumes, reflecting how homeowners are adjusting to higher borrowing costs and housing prices. Despite the increases, overall foreclosure activity remains below pre-pandemic levels [1][4]. These patterns provide important context for understanding the role of regional differences in shaping foreclosure trends.
Regional Foreclosure Hotspots
These year-over-year changes have highlighted distinct regional hotspots. The Southeast, Midwest, and West regions were the primary drivers of foreclosure activity in 2025 [2][5]. The broader national trends underscore how affordability challenges and sustained borrowing costs are impacting homeowners across various regions, rather than being confined to isolated local markets [2][5].
"This geographic spread... suggests that foreclosure activity is being shaped by nationwide affordability hurdles, persistent borrowing costs, and localized market pressures rather than a single regional driver."
– Megan Hunt, Marketing Manager, ATTOM [10]
Texas stood out with particularly sharp growth, as foreclosure activity surged 63.23% year-over-year by the third quarter of 2025 [7]. The widespread distribution of foreclosure hotspots across multiple regions points to economic pressures - such as rising insurance premiums, higher mortgage rates, and increased home prices - that are straining borrowers across the country [7].
Investment Opportunities and Strategies
Finding Investment Opportunities in High-Rate Areas
Real estate investors eyeing 2025 should focus on states with the highest foreclosure activity. Florida, South Carolina, Illinois, Delaware, and Nevada top the list for foreclosure rates. Within these states, specific counties like Osceola County in Florida, Dorchester County in South Carolina, and Clinton County in Illinois are particularly active, offering concentrated opportunities [5].
Keeping an eye on foreclosure starts is key - these increased by 20% year-over-year in October, with 25,129 properties entering this phase nationwide [1]. Targeting these preforeclosure properties allows investors to negotiate directly with homeowners before the properties hit auction. This strategy often leads to better deals, whether through short sales or direct purchases.
For those focusing on Massachusetts, tools like LeadList.Pro (https://leadlist.pro) can be game-changers. This platform provides weekly probate and preforeclosure leads, enriched with AI insights and manual verification. Investors get real-time data from local courts, including distress scores, property details, and contact info, all formatted in easy-to-use CSV files. Accessing this kind of detailed information early in the foreclosure process can help investors connect with homeowners when they’re most open to alternative solutions.
By identifying these opportunities, investors can position themselves to weigh the potential risks and rewards effectively.
Assessing Risks and Rewards
High-activity areas can be promising, but they come with their own set of challenges. One key factor is the variability of foreclosure timelines, which directly impacts holding costs and capital turnover. The national average foreclosure timeline dropped to 608 days in Q3 2025, a 25% decrease from the previous year [7]. This shorter timeline means properties are moving through the system faster, which can be an advantage for investors.
However, auctioned properties are sold "as-is", often with liens or repair needs [13]. Amy Loftsgordon, an attorney with Nolo, explains:
"The main benefit of buying a home at a foreclosure sale is that the price is usually much lower than if you purchase a property through a regular sale. However, competition can be stiff for the best deals" [13].
Thorough due diligence is non-negotiable. Investors should work closely with real estate attorneys to uncover any hidden liens and assess the condition of properties before making commitments. With one in every 3,992 housing units receiving a foreclosure filing in November 2025 [6], the market offers plenty of opportunities - but only for those who carefully evaluate both the financial and legal aspects of each deal.
Conclusion
Summary of National and Regional Trends
The foreclosure landscape in 2025 reflects a shift toward market stabilization. Over recent months, foreclosure filings have risen by 19–21% year-over-year, depending on the month, signaling a notable increase [10]. Even with this uptick, the numbers remain far below the peak levels seen during the Great Recession [2]. This trend suggests that homeowners are gradually adapting to higher costs and broader economic changes [6]. Certain states stand out for their heightened foreclosure rates, with Delaware (1 in 1,924 units), South Carolina (1 in 1,973), and Nevada (1 in 2,373) leading by late 2025 [12]. On another note, the average foreclosure timeline has dropped to 608 days in Q3 2025 - a sharp 25% reduction from the previous year - indicating a quicker process for properties moving through the system [7]. These patterns highlight the importance of localized strategies for navigating high-activity markets.
Recommendations for Investors
For investors, leveraging foreclosure data effectively can unlock valuable opportunities. States like Florida, Illinois, and Nevada, which show concentrated foreclosure activity, offer promising entry points at both state and county levels [5]. The 20% year-over-year rise in foreclosure starts also points to an expanding pool of preforeclosure properties, where direct negotiations with homeowners could be an option [1].
Investors targeting areas like Massachusetts should consider tools such as LeadList.Pro, which provides weekly, verified preforeclosure leads - critical for making timely decisions. Acting quickly in states with shorter foreclosure timelines, combined with thorough due diligence, is key. By using reliable data and maintaining a disciplined approach to assessing risks, investors can tap into the opportunities that 2025’s foreclosure trends present.
FAQs
::: faq
What is causing foreclosure rates to rise in 2025?
Foreclosure rates in 2025 are climbing, driven by a mix of economic challenges and personal financial struggles. High inflation and rising mortgage interest rates have pushed monthly housing costs to uncomfortable levels, leaving many homeowners struggling to keep up. On top of that, everyday essentials like groceries, energy bills, and homeowners insurance have become more expensive, squeezing household budgets even tighter.
Unexpected financial blows - like losing a job, sudden medical bills, or costly car repairs - can tip already stretched families into default, especially for those without savings to fall back on. The numbers tell the story: foreclosure starts jumped 6% from the previous month and are up 20% compared to the same time last year. Even worse, foreclosure completions have surged by 32% year-over-year as of October 2025. These statistics paint a clear picture of the mounting pressure on homeowners across the country. :::
::: faq
How long does the foreclosure process take in different states?
The time it takes to complete a foreclosure process can differ greatly depending on the state, largely because of variations in legal procedures. States generally follow one of two paths: judicial or non-judicial foreclosure, and the choice between them greatly influences how long the process takes.
In non-judicial states like California, Texas, and Georgia, foreclosures tend to move quickly - often wrapping up in about 100 to 120 days. This is because these states skip the court system entirely, streamlining the process. On the flip side, judicial states such as New York, New Jersey, and Massachusetts require lenders to go through the courts. This involves filing lawsuits, securing court judgments, and observing redemption periods, which can stretch the timeline to 12 to 24 months or even longer.
For professionals operating in judicial states where foreclosures take longer, having access to early data is essential. Tools like LeadList.Pro offer weekly updates on probate and pre-foreclosure leads in Massachusetts. These leads are enhanced with AI-powered insights and real-time court data, helping users get a head start in navigating the process. :::
::: faq
How can investors take advantage of rising foreclosure rates in 2025?
Rising foreclosure rates in 2025 are creating a window of opportunity for investors to acquire properties at prices below market value. States like Florida, Illinois, and South Carolina are seeing the highest levels of foreclosure activity, making them prime locations for finding distressed properties.
Here are a few strategies to help investors make the most of this trend:
- Focus on high-activity regions: Zero in on areas with elevated foreclosure rates, as they offer a larger selection of discounted properties.
- Utilize pre-foreclosure tools: Platforms like LeadList.Pro provide AI-powered property leads, complete with distress scores and verified contact information, allowing investors to act early and stay ahead of competitors.
- Be strategic with timing: Keep an eye on quarterly foreclosure reports to identify peak activity periods, enabling you to move quickly and secure deals before the market heats up.
By combining data-driven tools with a well-timed approach, investors can take advantage of the shifting foreclosure landscape in 2025 to expand their portfolios and boost returns. :::


