
Loan Delinquency Rates: 2025 Market Trends
Loan delinquency rates rose in 2025, reflecting economic pressures like a weaker labor market, rising household debt, and inflation. By Q3, the national mortgage delinquency rate hit 3.99%, with FHA loans showing the highest delinquency at 10.78%. Key drivers included:
- Economic Slowdown: Job growth stalled, with private payrolls adding just 22,000 jobs in January 2026.
- Rising Debt: Household debt reached $18.59 trillion by Q3 2025, with student loan delinquencies spiking to 9.4%.
- FHA Challenges: Seriously delinquent FHA loans rose by 50 basis points year-over-year, driven by higher costs and expiring protections.
- Regional Disparities: Southern states like Louisiana and Texas saw the highest delinquency increases, while Massachusetts maintained lower rates.
Foreclosure activity also increased, with 289,441 filings in 2025, but foreclosure timelines shortened to an average of 592 days. Real estate professionals focusing on distressed properties should prioritize areas with FHA loans and leverage tools like LeadList.Pro to spot profitable preforeclosure deals early.
::: @figure 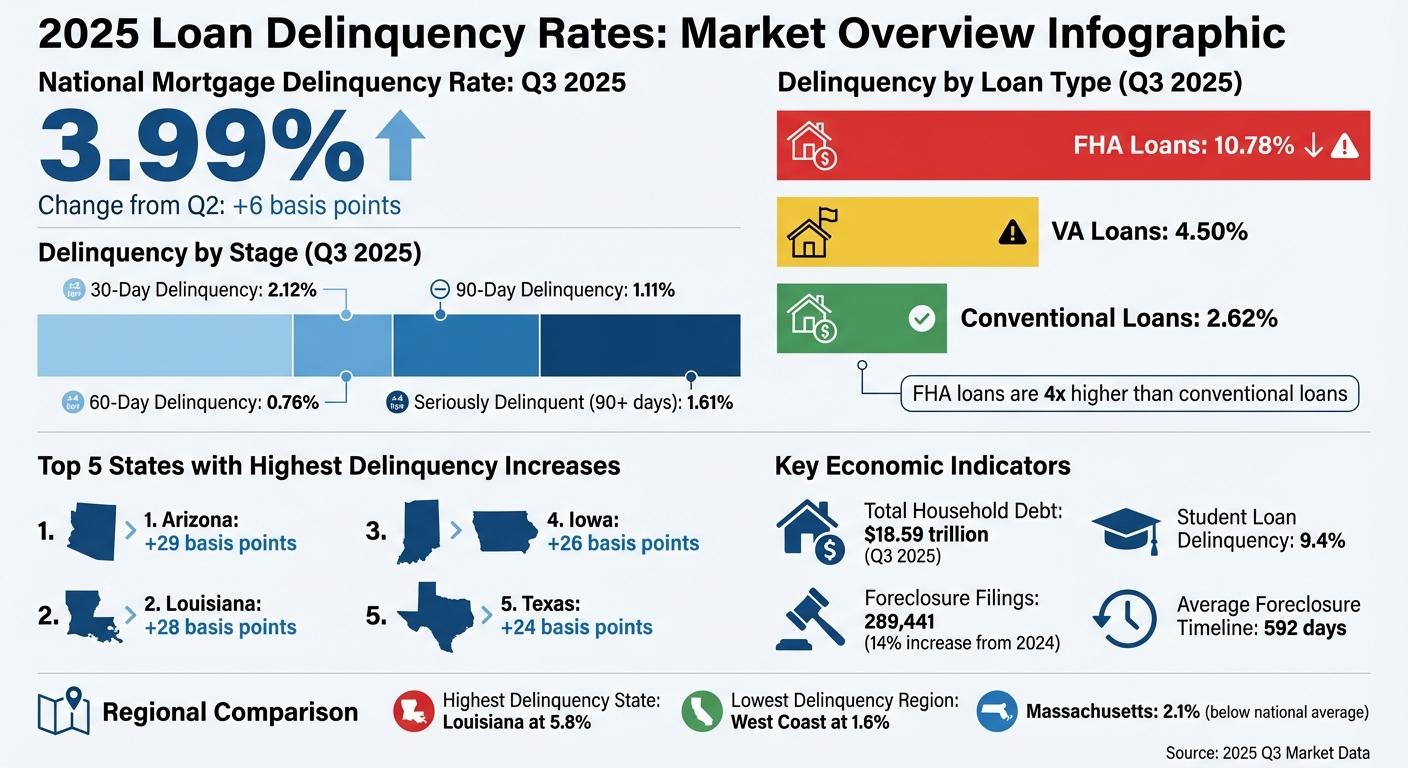 {2025 Loan Delinquency Rates by Type and Quarter - Comprehensive Market Overview}
:::
{2025 Loan Delinquency Rates by Type and Quarter - Comprehensive Market Overview}
:::
2025 Loan Delinquency Rates by Quarter
Delinquency Rates by Stage
Mortgage delinquency rates showed a steady climb, reaching 3.99% by Q3 2025 - a modest increase of 6 basis points compared to Q2 [1].
Breaking it down further: loans 30 days past due increased slightly to 2.12%, up 2 basis points from the previous quarter. Meanwhile, the 60-day delinquency rate rose by 4 basis points to 0.76%, and the 90-day delinquency rate remained steady at 1.11% [1].
| Delinquency Stage | Q2 2025 | Q3 2025 | Change |
|---|---|---|---|
| 30-Day Delinquency | 2.10% | 2.12% | +2 bps |
| 60-Day Delinquency | 0.72% | 0.76% | +4 bps |
| 90-Day Delinquency | 1.11% | 1.11% | 0 bps |
| Total Delinquency Rate | 3.93% | 3.99% | +6 bps |
For loans classified as seriously delinquent - those 90 days or more overdue or in foreclosure - the rate inched up to 1.61% in Q3, reflecting a 4 basis point increase from Q2 [1].
These figures highlight how each stage of delinquency evolved throughout 2025.
How Delinquent Loans Progressed
Looking at how delinquent loans moved through different stages over the year, trends varied by loan type. For mortgages, 1.28% of loans transitioned into the 90+ day delinquency category in Q3 2025, compared to 1.08% during the same period in 2024. Auto loans followed a similar trend, with 2.99% of loans progressing into serious delinquency in Q3 2025 versus 2.90% a year earlier [5].
Student loans, however, faced the sharpest shift. The share of loans entering serious delinquency surged to 14.26% in Q3 2025, a drastic jump from 0.77% in Q3 2024. This spike was largely due to the resumption of federal payment reporting after the pandemic-era forbearance period [5]. Despite these changes, 97.4% of mortgages remained current by the end of Q3 [6].
Donghoon Lee, Economic Research Advisor at the Federal Reserve Bank of New York, explained: "Household debt balances are growing at a moderate pace, with delinquency rates stabilizing. The relatively low mortgage delinquency rates reflect the housing market's resilience, driven by ample home equity and tight underwriting standards" [5].
Auto loans also showed signs of strain, particularly in low-income census tracts, where delinquency rates climbed by 70 basis points in Q3. Overall, the auto loan delinquency rate increased by 5 basis points, marking the largest quarterly rise since early 2024 [4].
Together, these shifts in mortgage, auto, and student loan delinquencies paint a picture of the broader financial pressures seen in 2025. These developments provide important context for analyzing state-level trends and market responses.
Delinquency Rates by Loan Type
Conventional, FHA, and VA Loan Performance
In 2025, the delinquency trends across the three primary loan types - Conventional, FHA, and VA - told a clear story. FHA loans had the highest delinquency rates, hitting 10.78% by Q3 2025. This figure was more than four times higher than the 2.62% rate for conventional loans. VA loans landed in the middle, with a Q3 delinquency rate of 4.50%.
| Loan Type | Q1 2025 Rate | Q3 2025 Rate | YoY Change (bps) |
|---|---|---|---|
| Conventional | 2.70% | 2.62% | -1 |
| FHA | 10.62% | 10.78% | +32 |
| VA | 4.63% | 4.50% | -8 |
When focusing on seriously delinquent loans - those 90 days or more past due or already in foreclosure - the gap became even wider. FHA loans reached a seriously delinquent rate of 4.42% by Q3, while conventional loans were significantly lower at 1.07%.
VA loans, however, saw a notable foreclosure spike early in the year. The foreclosure inventory rate rose to 0.84% in Q1 2025, marking the highest level since late 2019. This increase also represented the largest quarterly jump ever recorded since the survey began in 1979. The surge followed the expiration of a voluntary foreclosure moratorium at the close of 2024 [2][3].
These trends provided a foundation for comparing year-over-year changes.
2025 vs. 2024 Delinquency Rates
Year-over-year data painted a picture of shifting borrower behaviors influenced by changing economic conditions. FHA loans saw an increase of 32 basis points in delinquency rates from Q3 2024 to Q3 2025. Meanwhile, conventional loans improved slightly, dropping by 1 basis point, and VA loans showed a decline of 8 basis points [1].
The differences were even more pronounced in the seriously delinquent category.
Marina Walsh observed: "Since this time last year, the FHA seriously delinquent rate - which includes 90+ day delinquencies and loans in foreclosure - increased by almost 50 basis points. In contrast, the conventional and VA seriously delinquent rates remained relatively flat" [7].
This sharp rise among FHA loans highlighted how lower- and moderate-income borrowers bore the brunt of economic pressures in 2025. Rising costs and employment uncertainty left these borrowers particularly vulnerable. For real estate professionals, these trends could indicate potential opportunities in the distressed property market, as FHA borrowers struggled the most, while conventional loans maintained relative stability.
Delinquency Rates by State and Region
States with the Highest Delinquency Increases
The 2025 delinquency data highlighted a clear divide across the United States. Southern states showed the highest rates of missed mortgage payments, while West Coast states consistently reported the lowest [8].
In Q3 2025, Arizona led the pack with a 29 basis point increase, followed closely by Louisiana and Indiana at 28 basis points, Iowa at 26, and Texas at 24 basis points [1].
Looking at overall delinquency rates for loans 30+ days past due in Q2 2025, Louisiana recorded the highest rate at 5.8%, with Mississippi close behind at 5.7%. West Virginia followed at 4.5%, while Alabama and Texas reported 3.9% and 3.8%, respectively [8]. In contrast, states on the West Coast, like Washington and Oregon, maintained much lower delinquency rates of just 1.6% [8].
Year-over-year data for Q1 2025 revealed a similar pattern. Florida saw the largest annual increase in delinquency rates at 46 basis points, while South Carolina (26 basis points), Georgia (25 basis points), Delaware (25 basis points), and Wyoming (24 basis points) also experienced significant upticks [3]. These increases reflected ongoing challenges for homeowners in these states, driven by weaker job markets and rising non-mortgage expenses, such as property taxes and insurance premiums.
This regional disparity sets the stage for understanding how areas with lower delinquency rates, like Massachusetts, present a different market dynamic.
Massachusetts Delinquency Trends
Massachusetts stood out in 2025 for its much lower delinquency rates compared to the national average and high-delinquency states. In Q2 2025, the state's 30+ day delinquency rate was just 2.1%, less than half the rates seen in Louisiana and Mississippi [8]. The Boston-Cambridge-Newton metro area performed even better, with a delinquency rate of only 1.7% [8], making it one of the most stable housing markets in the country. Across the state, Massachusetts had 788,931 active loans, with a total past-due rate of 3.16% in Q2 2025 - well below the national average of 3.91% (non-seasonally adjusted) [9].
The state's seriously delinquent rate (loans 90+ days past due or in foreclosure) was 1.15% in Q2 2025, compared to the national average of 1.57% [9]. Foreclosure starts were also notably low at 0.11%, compared to the national rate of 0.17%, while the foreclosure inventory stood at just 0.36% [9].
For real estate professionals working in Massachusetts, these lower delinquency rates create a unique environment. While the number of distressed properties is smaller, the leads that do emerge often represent high-quality opportunities in a stable market. Tools like LeadList.Pro offer access to verified preforeclosure and probate leads across all 14 Massachusetts counties. With AI-driven distress scores and real-time court data, these tools help analyze preforeclosure leads for profitability, even in a lower-volume market.
Massachusetts' stability is largely attributed to its stronger local economy, higher median incomes, and more resilient property values compared to Southern states facing higher delinquency rates [8].
What Caused Higher Delinquency Rates in 2025
Unemployment and Inflation Effects
In 2025, a mix of rising unemployment and persistent inflation created a financial storm that many households struggled to weather. By December 2025, the U.S. Civil Unemployment Rate reached 4.4% [10], while the Consumer Price Index climbed 2.7% compared to the previous year [10]. These figures, though moderate on paper, translated into significant financial stress for families.
Inflation drove up the cost of living across the board, making it harder for borrowers to stay on top of mortgage payments. As a result, the 30-day mortgage balance delinquency rate jumped to 3.68% in Q2 2025, climbing above pre-pandemic levels [8]. This marked a stark contrast to the historically low delinquency rates seen during the pandemic, when government stimulus and relief programs provided critical support.
Lower-income households were hit especially hard. In these communities, job losses and stagnant wages left little room to absorb rising costs. Auto loan delinquency rates in low-income Census Tracts rose by 70 basis points during Q3 2025 [4], underscoring how vulnerable these areas were to economic downturns. The expiration of pandemic-era relief measures - such as loan forbearance and enhanced unemployment benefits - further exposed these households to financial risks as economic conditions worsened.
Adding to these challenges, rising household debt created additional pressure.
Household Debt and Interest Rate Changes
The financial strain from unemployment and inflation was compounded by the growing burden of household debt. By Q3 2025, total household debt had climbed to $18.59 trillion, up 1% from the previous quarter [5]. Mortgage loans made up more than 70% of this debt, totaling over $12.9 trillion [8]. At the same time, higher interest rates drove up monthly payment obligations, squeezing household budgets even further.
Auto loans serve as a vivid example of this trend. Between 2020 and 2023, monthly payments for auto loans increased nearly 30%, fueled by rising vehicle prices and elevated interest rates [4]. The 10-Year Treasury Rate, which stood at 4.29% as of February 4, 2026 [10], ensured borrowing costs remained high throughout 2025.
With wages failing to keep pace with inflation, many households turned to credit cards and personal loans to cover everyday expenses. By late 2025, credit card balances hit $1.23 trillion [5], and average credit balances peaked at $106,700 in October 2025 - a five-year high [11]. This growing reliance on credit created a vicious cycle: borrowing more to manage existing debt only increased monthly financial obligations.
"Overall credit balances have continued to increase throughout 2025, reaching a five-year high... many are relying more on available credit to contend with a persistently higher cost of living." - Susan Fahy, EVP and Chief Digital Officer, VantageScore [11]
The impact of rising debt and interest rates wasn’t uniform across all borrowers. FHA borrowers, for instance, faced particularly steep challenges, with seriously delinquent rates climbing by nearly 50 basis points year-over-year by Q3 2025 [1]. Similarly, mortgage delinquencies in the 60–89 days past due category surged by 12.1% in October 2025 [11], reflecting the growing struggle for many to keep up with payments.
How Delinquency Rates Affect Foreclosure Timelines
Foreclosure Filing Patterns in 2025
In 2025, rising delinquency rates directly drove an uptick in foreclosure activity. Lenders initiated foreclosures on 289,441 U.S. properties, reflecting a 14% increase compared to 2024 [13]. Despite this rise in filings, the time to complete a foreclosure dropped by 22%, averaging 592 days in Q4 2025 [13].
This reduction in timelines signals a return to pre-pandemic norms, as court backlogs cleared and temporary protections expired. Typically, loans progress from being 30 days delinquent to 90+ days overdue, at which point unresolved cases often lead to foreclosure [3]. In 2025, completed foreclosures, or REOs, jumped 27% from 2024, with 46,439 properties repossessed nationwide [13]. However, regional differences were evident. For example, Massachusetts recorded 1,370 foreclosure filings in Q1 2025, a 30.1% drop compared to Q1 2024 [14], highlighting variations in how delinquency trends played out across states.
"November marks the ninth straight month of year-over-year increases in foreclosure activity, underscoring a trend that has steadily taken shape throughout 2025." - Rob Barber, CEO, ATTOM [12]
These shortened foreclosure timelines open up opportunities for earlier intervention.
Finding Preforeclosure Opportunities
With foreclosure activity accelerating, real estate professionals can tap into emerging opportunities by focusing on properties in the "Default" phase. This phase begins after a lender files a Notice of Default or Lis Pendens but before the property reaches auction [12]. It’s during this window that distressed homeowners may be most open to negotiations.
The key challenge lies in identifying preforeclosure properties early enough to act. Monitoring loans that are 90+ days delinquent provides a strong indicator, as these are most likely to enter foreclosure [3]. For instance, Massachusetts reported a 0.36% foreclosure rate and a 3.16% total past-due loan rate [9]. This suggests that while foreclosure starts in Boston declined from 186 in November 2024 to 130 in November 2025 [12], the opportunities haven’t vanished - they’ve just become harder to spot.
LeadList.Pro offers a solution to this problem. By providing weekly preforeclosure leads sourced directly from Massachusetts court filings, the platform equips professionals with actionable insights. Its AI-driven distress scores help prioritize outreach, while detailed property and contact information - including attorney details and mailing addresses - simplifies communication with homeowners during this critical stage. Subscriptions are available on a county-specific basis, ranging from $99 to $249 per month, with no long-term commitments, enabling real estate professionals to focus on high-risk areas where delinquencies are most likely to convert into foreclosures.
Since the average foreclosure now takes 592 days to complete [13], acting during the early default stage - when homeowners are 90 to 180 days overdue - provides ample time to craft solutions that benefit both parties. This proactive approach can make all the difference in navigating today’s evolving foreclosure landscape.
What Real Estate Professionals Should Know
Responding to Market Changes
In 2025, the national mortgage delinquency rate reached 3.99% by Q3, with 90+ day delinquencies jumping 18.6% compared to the previous year [17]. FHA loans played a major role in this trend, showing delinquency rates of 10.78% in Q3 - over four times higher than those of conventional loans [1]. Borrowers with FHA loans are under growing financial strain due to rising property taxes, a 31.3% increase in homeowners insurance premiums since 2020, and challenges in the labor market [17]. For real estate professionals, focusing on areas with a high concentration of FHA loans is critical, as these properties are more prone to foreclosure.
To navigate this market effectively, professionals need to move past broad, generic outreach strategies. Instead, adopt a data-driven approach using predictive analytics and AI behavioral insights. Look for leads that show signs of financial or situational stress - such as deferred property maintenance, tax liens, code violations, or life events like divorce or probate filings. This approach helps identify motivated sellers before their properties appear on the MLS [16]. These market dynamics highlight the importance of using localized data to pinpoint high-risk areas and act decisively.
Using Local Market Data
While national trends set the stage, regional and local data offer sharper insights into specific market conditions. For example, in Massachusetts, the 30-day mortgage delinquency rate was 2.1%, with the 90-day rate at just 0.5% [8]. Even in states with relatively low overall delinquency rates, there can still be concentrated areas of distress. The key lies in analyzing data at the county or metro level rather than relying solely on statewide averages.
Platforms like LeadList.Pro provide weekly preforeclosure leads in Massachusetts, sourced directly from court filings. Their AI-powered distress scoring system helps prioritize which homeowners to contact first. The service also offers detailed property information, including attorney contacts, mailing addresses, and ownership data, which simplifies the outreach process. With subscription options ranging from $99 to $249 per month and no long-term contracts, professionals can focus on areas with the highest potential.
Geographic targeting is essential because delinquency patterns can vary widely by region. In 2025, states like Arizona, Nevada, Georgia, and Texas experienced the largest increases in delinquency rates [15], while the West Coast generally maintained lower levels. Even within Massachusetts, areas with a high number of FHA loans or significant rises in insurance premiums can create localized pockets of distress that broader data might overlook. By leveraging detailed, localized information, real estate professionals can act during the crucial 90- to 180-day delinquency period, when homeowners are most open to exploring alternatives before their properties move to auction.
New 2025 Mortgage Report: Delinquencies Rise, Will Foreclosures Follow?
FAQs
::: faq
What caused loan delinquency rates to rise in 2025?
Loan delinquency rates saw an uptick in 2025, driven by a mix of economic pressures. A softening labor market left many borrowers struggling financially, making it tougher to stay current on their payments. This was particularly evident with government-backed loans like FHA and VA loans, which faced higher delinquency rates as foreclosure moratoriums ended and loss mitigation strategies shifted.
Wider economic factors added to the strain. Growing balances and increasing delinquencies in consumer debt - such as auto loans and credit cards - painted a picture of financial stress that extended into mortgage repayments. Together, these challenges fueled the rise in loan delinquencies throughout 2025. :::
::: faq
How do economic and regional factors impact loan delinquency trends across the U.S.?
Loan delinquency rates across the U.S. show noticeable regional differences, largely shaped by local economic factors like employment trends, income stability, and the health of the housing market. In 2025, areas grappling with economic setbacks - such as job losses or sluggish growth - are seeing higher delinquency rates, especially in mortgages and auto loans. Meanwhile, regions with thriving job markets and stable housing conditions are experiencing fewer delinquencies.
Several factors drive these patterns, including inflation, rising interest rates, and the overall strength of regional economies. Communities burdened by climbing costs and higher borrowing rates often face increased financial strain, which translates into more missed payments. In contrast, areas with strong local economies and consistent job opportunities are better able to keep delinquency rates in check. Recognizing these regional variations allows lenders and policymakers to create more focused strategies for managing financial risks. :::
::: faq
What opportunities can real estate professionals find in areas with high loan delinquency rates?
High loan delinquency rates can open doors for real estate professionals to succeed in distressed property markets. As more properties fall into preforeclosure or foreclosure, investors and agents have the chance to purchase homes at prices often below market value. For example, with mortgage delinquencies projected to hit 3.99% by the end of Q3 2025, the inventory of distressed properties ripe for rehabilitation or resale continues to grow.
Real estate professionals can concentrate on finding preforeclosure leads or exploring auction opportunities, especially in regions with higher delinquency rates. Leveraging tools like AI-powered lead services can help identify these properties early, giving professionals a competitive advantage. Beyond profits, rehabilitating distressed properties helps breathe new life into neighborhoods, benefiting both communities and the market. :::


